Urban Renewal in Grand Forks

Over the last few years my wife, Susie Caraher, and I have been chatting about the impact of urban renewal on our community and slowly conjuring up a research plan. We’re thinking about this work, in part, to support the Grand Forks Historic Preservation Commission’s recognition that urban renewal not only reshaped the city, but also that sites associated with these programs are soon eligible for nomination to Nation Register of Historic Places. More than that, there has been some renewed (heh) interest in urban renewal among scholars, and we imagine that a study of urban renewal in Grand Forks could contribute to this conversation (see, for example, University of Richmond’s Renewing Inequality project).

As per usual, I’m the junior partner in this research whose enthusiasm and interest often exceeds his ability to commit real time to moving it forward. Susie has been doing most of the footwork including wading through boxes of unarchived documents that tell the story of urban renewal in town. She also is much better making the interpersonal connections in the city and in city hall to support research into the very recent past.

This past week, she made a brilliant discovery through her connects with the city’s engineering department. She found maps from 1970 that show the city prior to urban renewal. Of particular interest was the neighborhood bound to the north by 1st Avenue South and the rail lines, to the south by 4th Avenue South, and to the east by Belmont. The western part of this roughly triangular shaped district consisted of a residential neighborhood which was home to the city’s Jewish community in the first half of the 20th century. By the 1960s, the Jewish community had begun to disperse and the neighborhood appears to have been in “decline.” As part of the urban renewal process, the city demolished the neighborhood and the Grand Forks Housing Authority built high density subsidized housing in the area.

We’re currently working to get these maps scanned, but here is a hasty digital photo of it:

These hand-drawn maps are important because they show the neighborhood as it was in the 1960s and offer an update to the plan of the district made in the latest Sanborn maps of the area (dating, I think, to 1916). I’ve blogged about this here. Between the two, there’s the basemap used in this redlining map from the 1930s, which appears to be a mid-century cadastral map for the city. (It would be great if we could locate a copy of the area descriptions on which redlining map is based, but they don’t appear to have been archived along with the map in the Library of Congress). It is noting, however, that the redline map of the neighborhood rated it “C” in the 1930s which was not the least desirable rating in the city (which was “D”). “D” neighborhoods tended to be the most recently developed districts in town largely to the west of Washington Street.

ND_GrandForks_19XX (2).

For those interested in the history of Grand Forks or North Dakotania, stay tuned! 

Three Thing Thursday: A Story, an Interview, and a Map

My grades were submitted on Monday, and I made the mistake of thinking that summer would begin now. Alas, the world had other plans with zoom meetings, deadlines, and an endless stream of emails from various administrative accounts across my university.

The good news is that despite the noise, there are plenty of fun things to keep my occupied this summer, and I thought that I’d share a few on an mid-May “Three Things Thursday”:

Thing the First

If you’re like me, you’ve already started to think about how to adapt your classes to another COVID-inflected semester in the fall. It seem highly likely that digital media are going to play a larger role in what you do in the classroom. 

The Digital Press at the University of North Dakota chatted a bit with Sebastian Heath about his recent edited volume DATAM: Digital Approaches to Teaching the Ancient MediterraneanYou can read the interview with Sebastian here. And you can download the a digital copy of the book, purchase it via Amazon, or from an independent bookstore

Another book that might help you think more broadly about teaching using digital approaches is Shawn Graham’s recently published Failing Gloriously and Other Essays. At a time when it is becoming more and more important that we act in a humane and understanding way toward our students and colleagues, Shawn’s book shines light on failure not as the prelude to triumph, but as a fundamental part of learning and empathy. We also had a long conversation with him that you can read here. You can download it for free here, buy it on Amazon here, or get a copy from an independent bookseller here.

Thing the Second

I’m pretty excited to have posted Shane Castle’s short story “Ursa” at the North Dakota Quarterly blog this morning. During my time as editor, it is one of my favorite stories. 

The thing that makes is so appealing is the ambiguity of it all. Is the story meant to be touching and heartfelt? Is it just an exercise in the absurd? Is it meant to be funny? All these things? 

There’s also something about the story that makes it feel appropriate for our current situation. The story reckons with the experience of coming out of hibernation, memories of our past, pre-COVID life, our efforts to stay connected over distance, and the awkwardness in how we engaged with others. In short, the story is so much of what unusual, non-commercial, and (broadly) experimental fiction can be. 

If you have a few minutes over lunch or while sipping an evening cocktail, give it a read.  

Thing the Third

The final thing this Thursday is a map prepared by a team led by my old buddy David Pettegrew. As I’ve mentioned on a previous Three Thing Thursday, he’s been leading an ambitious project, Digital Harrisburg, designed to create rich historical maps of Harrisburg, Pennsylvania. This past week, we released yet another update to the maps of Harrisburg’s “Old Eighth Ward” which was an African American neighborhood destroyed to produce the state capital area. Check out the interactive maps here

Needless to say, this project has inspired me to think more critically and dynamically about my own community and how constructing data-rich maps can help us understand our community in the past, but as importantly, in the present. 

More on Chris Witmore’s Old Lands

I finished Christopher Witmore’s  Old Lands: a chorography of the Eastern Peloponnese (2020) this weekend and thoroughly enjoyed it. As I said last week, it was a great way to kick off my summer reading and a useful tonic for a summer without fieldwork.

This is the kind of book that will likely resist any kind of useful, formal review. It’s easy enough to note places where Witmore overlooked scholarship relevant to his larger arguments (e.g. Kostis Kourelis’s important 2007 Hesperia article, “Byzantium and the Avant-Garde” would have fit nicely into Witmore’s treatment of Corinth, for example, or Evi Karouzou’s 2014 monograph,  Les jardins de la Méditerranée: agriculture et société dans la Grèce du sud, 1860-1910, would have complemented and expanded his considerations of the agricultural history of the Corinthia and Argolid, or, finally, David Pettegrew’s observations on Kromna on the Isthmus of Corinth would have complicated Witmore’s analysis of that site). Likewise, it will also be convenient for a reviewer to observe that the routes Witmore took through the Northeast Peloponnesus overlooked certain areas like the Southeastern Corinthia, the Western Argolid, or the Inachos Valley. As a result, he overlooked the delicious abundance of souvlaki stands at the intersection of the old national road and old Peloponnesian narrow-gauge railway in the village of Myloi. There are, of course, little factual slips from time to time: the Athos canning plant near Nauplio (referred to in Route 18) is probably the former Kyknos canning plant.

None of this really matters, however, because the book is not meant to be an exhaustive history of the landscape of the Argolid and Corinthia. Instead, the book represents an unapologetically personal look at the region. This approach reflects Witmore’s commitment to the tradition of chorography which he offers as both a kind of critical commentary on the ancient writings of Strabo and Pausanias, the Ottoman period in the writings of Evlyia Celebi, the early modern works of Jacob Spon and George Wheler and the Expédition scientifique de Morée, and the modern period with the travels of Martin Leake, Edward Dodwell, and Gertrude Bell. Contemporary scholars, John Cherry, Alex Knodell, join Witmore from time to time as do various other Greeks, American students, and family members. At the center of the book, however, is Witmore and his interests, relationships, and restless feet guide carry the reader through the Greek countryside.

Chorography, if I understand it, challenges views of the landscape dominated by cartography, geography, and modern landscape archaeology which serves to create the homogeneous spaces of the modern map. If the lines and points of the modern scholar serves to measure and rectify space into some form of universally recognized pattern, the routes of the chorographer are embedded in the landscape itself and follow the contours of the land, the rhythm of the fields, and the often abrupt discontinuities between the present and a visible past. While archaeologists have often seen Witmore’s work elsewhere as overly (and maybe even oppressively?) theoretical, Old Lands serves as a critical and important corrective. Witmore’s goals are not to use the eastern Peloponnesus as at the basis for some kind of theoretical exegesis, but to offer this landscape as a kind of anti-theory (echoing, in some ways, the work of Peter Sloterdijk who appears frequently in his footnotes). For example, the landscape is not a text to be decoded or deconstructed. It is not a place to be unpacked, analyzed, compared, or abstracted. Instead, it’s a space to be experienced and encountered.  

At times (and as an avowedly selfish reader), I wondered how Witmore’s chorography relates to our modern and perhaps contemporary experience of tourism. His effort to defamiliarize a landscape well-known to archaeologists and scholars evokes the modern promise of the tourists gaze which seeks to bridge the gap between the everyday and the exotic. Witmore makes romantic a walk through an olive grove which represents one of the most banal and unremarkable experiences of time in the northeast Peloponnesus. Fishfarms, irrigation systems, terrace walls, dirt and paved roads, goat tracks, maquis, and even the annoying hillsides of Jerusalem sage take on a wondrous quality in Witmore’s work. But is this because these experiences are wondrous or because, in Witmore’s able hands, he is creating a wondrous experience for the reader in much the same way an able tour guide brings a landscape or encounter alive and something as banal as “Mexican Coke” becomes an invitation to an unfamiliar world. (This relates, of course, to my own work along similar lines here.)

Witmore’s work also nudged me to think a bit more about my idea of a “slow archaeology.” While most of my work has focused on “slow” as a challenge to our technologically mediated encounters with archaeological work, Witmore’s chorography with its attention to the details of experience and encounter feels like it occupies a similar space. The absence of any technology in Witmore’s work (other than the maps which he includes at the end) and the emphasis on the individual rather than the team of archaeologists, the procedures of data collection, and the methods of analysis, creates a view of archaeological practice that differs from the almost-automated routines of the intensive pedestrian surveys or of systematic excavation that so defined the archaeological landscapes of the northeastern Peloponnesus.

In this way, Old Lands offers a critique of contemporary archaeological practices, but doesn’t reject them. It also offers a new way to think about the field of Mediterranean archaeology. In recent years, Mediterranean archaeologists have pushed more archaeological practices that align more closely with our peers in “world archaeology.” This frequently involves more specialized training in scientific methods, the use of digital tools, and systematic approaches grounded in the literature of anthropological archaeology. Witmore doesn’t contest this, but by grounding his approach in chorography, he proposes an alternative that is no less grounded in the latest technologically mediated approach to the past, but is also explicitly aware of the experience of being in the landscape. 

Maps, Maps, Maps

I’ve been working on maps for my Tourist Guide to the Bakken. This is a tedious task made lighter only by the remarkably robust GIS data available from the great states of North Dakota and Montana.

BOO! I had to remove this content at the request of our publisher!


Archaeological Maps

One of my responsibilities with the Pyla-Koutsopetria Archaeological Project this fall is to produce our final distribution maps. In fact, this was a collaborative effort as David Pettegrew checked all my calculations which were the basis for the first round of maps, caught a few little issues, and then created the GIS layers. All I had to do was to package these and make them legible as maps.

I find this part of the process fairly frustrating. My tastes in maps run to the old school and my patience for archaeological maps with incredibly high data density is pretty limited. As I result, I tried to produce maps that communicated a fairly limited amount of data in as clear a way as possible. We collected our data from a fair regularly shaped set of units set up on a coastal plain and a series of flat-topped coastal ridges surrounded by steep slopes and narrow valleys.

Here is the survey area with almost no archaeological data except the grid. The different colors of grid outlines represent the different zones that we discuss in our analysis. I have kept the 4 m topo lines rather than using only 8 or 12 m because I think that they communicate the rugged topography more effectively. I made them a rather light gray color so that the survey grid popped out more. I did not include elevation labels on the topolines because the coastline is clearly visible on the bottom of the frame.  Finally, I offset the map to the west/left in its frame to make room for the legend, north arrow, and scale on the right side of the frame. 

PKAP Zones

My next map shows the overall artifact density across the site with the colored outlines still representing the different zones. I think the outlines are hard to see against the gray gradient used to indicate different artifact densities. The legend records the artifact densities per hectare.

PKAP ZoneDensity

The gray gradient for artifact densities on the next map are made 40% transparent. The distribution of Early Roman ceramics are red. 

PKAP RomanEarly

I think this design shows low density scatters (like the Classical period) and high density (like the Late Roman) scatters effectively.

PKAP Classical

PKAP RomanLate

I remain torn about the need for a north arrow.

Corinth’s Byzantine Countryside

The distribution of Byzantine sites in Corinth’s immediate hinterland is poorly known. No Byzantine monuments exist in the Isthmia valley immediately to the east of the City of Corinth in contrast to the numerous Byzantine churches discovered during the early phases of excavation of the city center or the cluster of standing churches around the village of Sophiko to the south. The absence of any standing Byzantine remains might be an accident of preservation. It could also suggest that the immediate hinterland of Corinth had few nucleated settlements like monasteries and villages. It seems possible that Byzantine Corinthians lived in the city of Corinth, the village of Kenchreai, and perhaps a settlement centered on the eastern part of the Hexamilion wall near the long-abandoned Panhellenic sanctuary at Isthmia.

Over the past week or so, I’ve been working on analyzing the distribution of Byzantine pottery discovered during the work of the Eastern Korinthia Archaeological Survey. In the chronological scheme used by the survey, material from the Byzantine period was divided into two periods: Early Medieval (700-1200) and Late Medieval (1200-1500). In the map below, the red triangles are the Early Medieval artifacts and the green are Late Medieval.

Byzantine Pottery

There are four main areas in the fertile plain east of the city of Corinth that show Early and Late Medieval ceramic material. One area may be associated with a now-destroyed church dedicated to Ag. Paraskevi. In a series of fields disturbed by plowing and recent construction, there is a complex and extensive assemblage of Early and Late Medieval material as well as a significant assemblage of Late Roman material. The assemblage included relatively common glazed finewares from the Early and Middle Byzantine period as well as table wares and utility wares. Some 2 km northwest of the Ay. Paraskevi assemblage, appears another cluster of pottery perhaps associated with ecclesiastical architecture. In a 100 square meter amidst architecture fragments suggesting monumental Christian architecture appear another similar scatter of Byzantine material which featured fineware, kitchen wares, utility vessels from both the Early and Late Medieval periods. As similar small assemblage appears on the steep slopes to the northwest of the Late Roman harbor of Kenchreai. In these units, another 200 square meter area produced a small scatter of Medieval material including finewares and utility wares. Finally, a deeply ploughed field at the base of Mt. Oneion measuring about 350 square meters produced an assembalge of Early Medieval and Late Medieval fine and ultility wares as well as a few sherds from the Venentian and Ottoman periods. Like the other scatters, this assemblage shows both Early and Late Medieval pottery with both table ware and utility wares.

The remarkable thing about these four little clusters of Byzantine pottery is how different the distribution was from period of earlier and later periods.  This is the same map showing Late Roman pottery.

Late Roman

This is a textbook example of a continuous carpet of artifacts and is typical of the Late Roman period throughout Greece. (For some critical comments on this see David Pettegrew’s “The Busy Countryside of Late Roman Corinth,” Hesperia 76 (2007), 743-784 for a PDF go here).

What is also remarkable is how different the distribution is from that of later periods.  The distribution of material from the Ottoman/Venetian period (1500-1800) for example does not overlap entirely with material from the Byzantine period.

OttomanVenPottery

It is only in the Early Modern period (1800-1960) where later material becomes an important component of the Byzantine sites, but this seems to be associated with a general expansion of activity in the Corinthian countryside. (For a more extensive discussion of this see T. E. Gregory, “Contrasting Impressions of Land Use in Early Modern Greece: The Eastern Corinthia and Kythera,” Hesperia Supplement 40 (2007), 173-198.)

Early Modern Pottery

This very preliminary analysis of the Byzantine material from EKAS resonates with recent studies of the Byzantine countryside in the Nemea Valley immediately to the south. (For this see E. Athanassopoulos, “ Landscape Archaeology in the Medieval Countryside: Settlement and Abandonment in the Nemea Region,” IJHA 14 (2010), 255-270.) Athanassopoulos suggested that the 12th and 13th century landscape of the Nemea valley clustered on arable land or on the lower slopes of valley sides (258). Moreover, the sites tended to represent small and medium scale agricultural production (261).

It is also important to realize that my brief analysis here is preliminary. Sanders has established the basic unreliability of most existing typologies and chronologies for pottery of this period as well as difficulties identifying artifacts datable to the Medieval period in general. A the same time, it is nevertheless striking that such pronounced clusters of Byzantine material would appear in the Corinthian landscape. More importantly, these clusters appear largely independent of the continuous carpet of Late Roman finds and the clusters of post-Byzantine material published by Gregory and, earlier, analyzed by Caraher.

Cross-posted to Corinthian Matters.

Fourth of July

This past year my parents put my childhood home on the market. For whatever reason, I didn’t feel any great emotional response to these developments. Maybe it’s because my wife and I have been working hard to create our own home, or maybe it’s because I have spent so little time in my childhood home since I left for graduate school in the early 1990s.  Whatever the reason, I began to think about the area where I grew up on my long flight home from Cyprus and during my fitful attempts to negotiate jetlag over the past couple of days.

I realized that I did not know very much about where I grew up archaeologically. For example, I had no real idea when my childhood home was built. I had a vague feeling it was built in the 1960s, but nothing more specific than that. (I am regularly shamed by my buddy Kostis Kourelis meditations on his neighborhood in Philadelphia!). My efforts here are a low-key, more academic and hnerdtastic version of this.

I grew up in North Wilmington in a typical east coast suburb. My increasingly fragmented childhood memories include an index of hyperlocal places, routes, and features in the landscape. I plan to maps these in relation to contemporary and historical aerial photographs and maps in ArcGIS, and to record some of my memories here in text form.

Our summertime activities were centered on the nearby Windybush Swim Club – the local pool and “the street” – Wheatfield Drive – where our family home was. Our street (as I’ll talk about later in more detail) was largely built in the late 1960s.  The pool was built in a depression at the “bottom” of Windybush road to serve that community. The community was largely built in the 1950s and the pool was built in 1958.

As kids, each Fourth of July we would decorate our bikes and ride them first down our street (Wheatfield Drive) in a parade (presumably organized by the local civic association). After that, we’d parade down Windybush Road to the swim club where we’d have a cook out and do what, as kids, we’d do every day we could all summer – play in the pool.

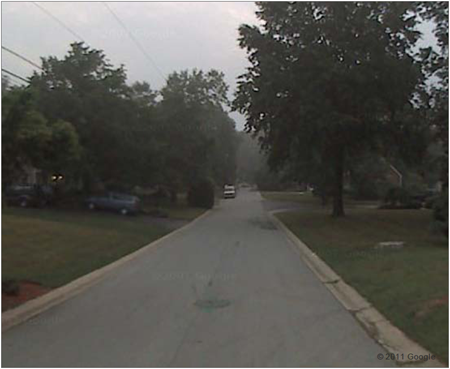
Here’s the Google Streetview perspective of the route down Windybush Road.

image

To the pool.

image

I plotted our routes here on this GIS map.  The background image is from Bing Maps which integrates with ESRI’s ArcGIS (h/t to Brandon Olson).

 FourthofJuly

Here I’ve used the 2007 digital 0.25 meter orthophotos of the State of Delaware at a scale of 1:2,400.

FourthofJuly2007

And here I use the 1968 Agricultural Stabilization and Conservation Service photographs. These are as close as I can get to what this area looked like when I was a kid.

FourthofJuly1968